
A model is a network of blocks


Model codeOpen in Quisim
NumberInput { id: number0; initValue:125; label:"1/λ"; lower:1 }
NumberInput { id: number1; initValue:100; label:"1/µ"; lower:1 }
Wire { from: number0.measureValue; to: rnd0.parameterMean }
Wire { from: number1.measureValue; to: rnd1.parameterMean }
RandomExponential { id:rnd0 }
RandomExponential { id:rnd1 }
Wire { from:rnd0.measureRandomVariate; to:arrive0.parameterDuration }
Wire { from:rnd1.measureRandomVariate; to:perform0.parameterDuration }
Arrive { id:arrive0 }
Pipe { from:arrive0.outlet; to:queue0.inlet }
Queue { id:queue0 }
Pipe { from:queue0.outlet; to:perform0.inlet }
Perform { id:perform0 }
Pipe { from:perform0.outlet; to:leave0.inlet }
Leave { id:leave0 }
Wire { from: queue0.measureLoad; to: chart0.parameters[0] }
Statistics { id: statistics0; height:48; width:128; label:"Sojourn\ntime" }
Wire { from: leave0.measureSojourn; to: statistics0.parameters[0] }
Chart { id: chart0; height:66; width:384 }- Discrete-event simulation: the state changes only at events (an arrival, the end of a service); the clock jumps from one event to the next
- By the end of this session you will have built this model yourself. More: How a discrete-event simulation runs
The Quisim window
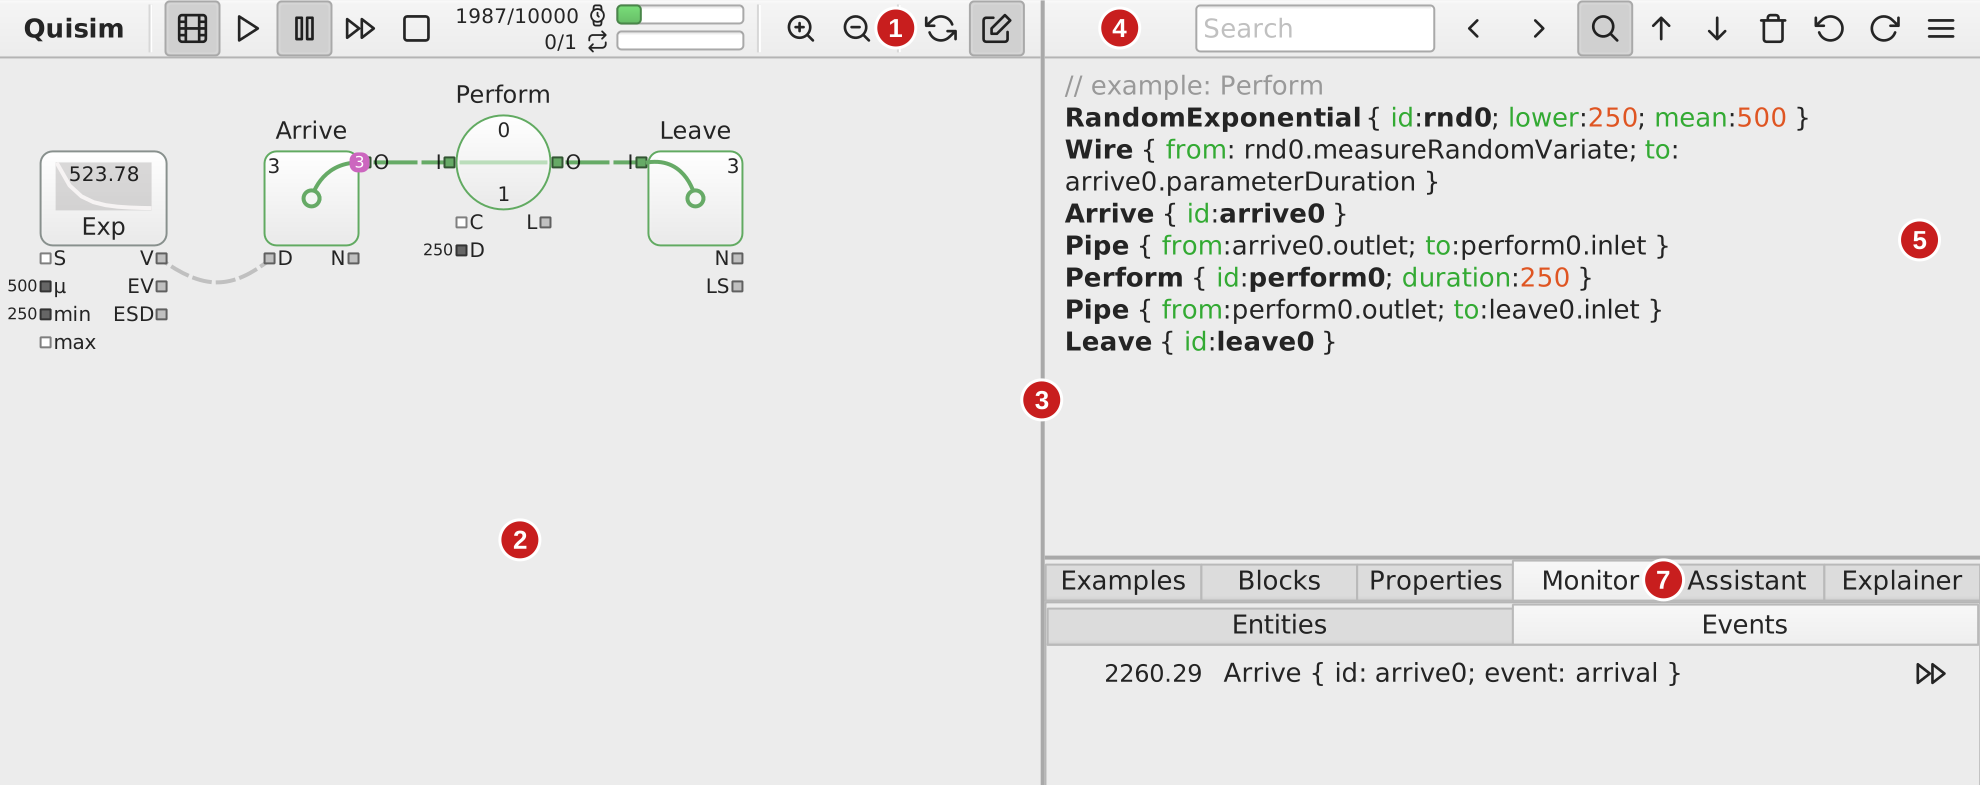
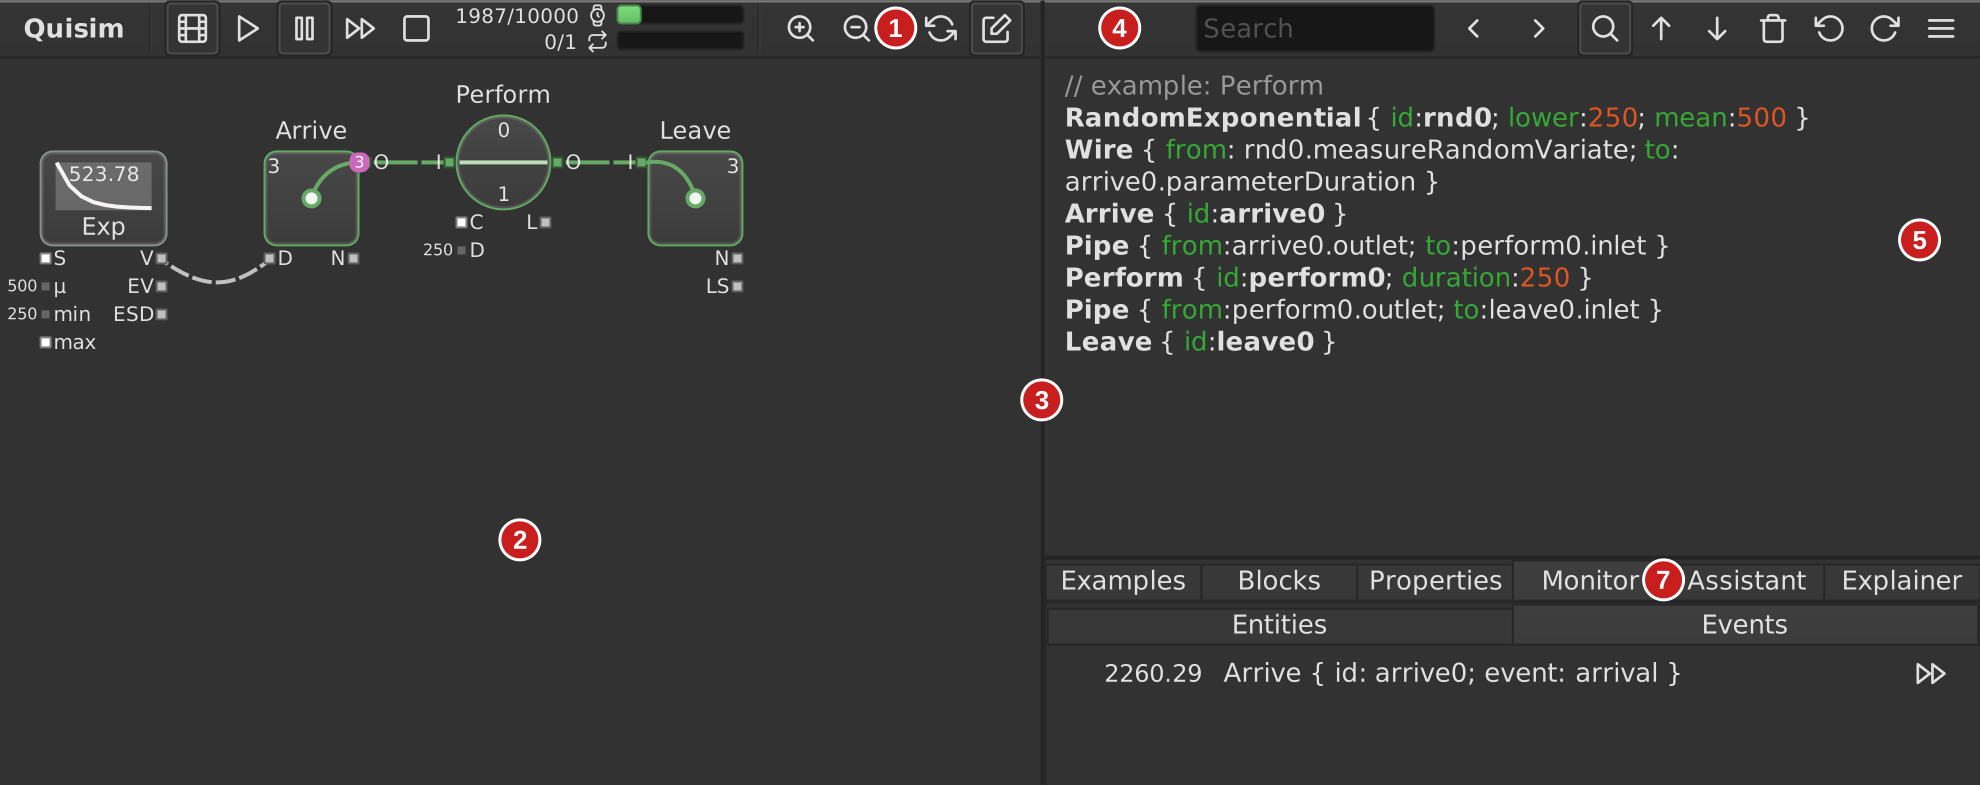
Canvas on the left, model code on the right: they are two views of the same model. See the UI guide.
Blocks, sockets, pipes and wires
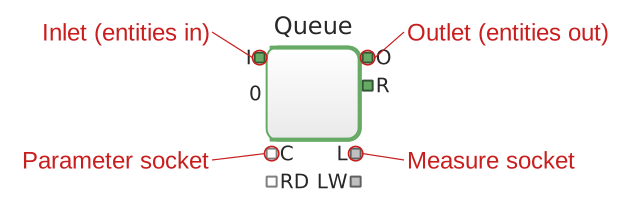
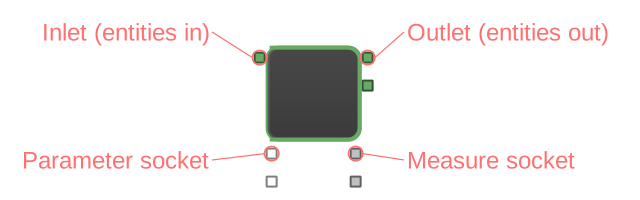
- Entity blocks move entities (Arrive, Queue, Perform, Leave); value blocks give numbers; report blocks show results
- Green entity sockets are joined by pipes: entities flow. Silver data sockets are joined by wires: numbers flow, from a measure (bottom right) to a parameter (bottom left)
More: Block Sockets, connecting blocks
Build it: 3. A server
- Delete Leave (with connections)
- Add Perform; pipe Arrive O → Perform I
- Drag from Perform's O into the Blocks tab onto Leave's inlet: Leave is added, already connected
- Second RandomExponential: V → Perform's D
- New NumberInput, type 100 (), N → its µ


Model codeOpen in Quisim
NumberInput { id: number0; initValue:125; label:"1/λ" }
NumberInput { id: number1; initValue:100; label:"1/µ" }
Wire { from: number0.measureValue; to: rnd0.parameterMean }
Wire { from: number1.measureValue; to: rnd1.parameterMean }
RandomExponential { id:rnd0; seed:11 }
RandomExponential { id:rnd1; seed:22 }
Wire { from:rnd0.measureRandomVariate; to:arrive0.parameterDuration }
Wire { from:rnd1.measureRandomVariate; to:perform0.parameterDuration }
Arrive { id:arrive0 }
Pipe { from:arrive0.outlet; to:perform0.inlet }
Perform { id:perform0 }
Pipe { from:perform0.outlet; to:leave0.inlet }
Leave { id:leave0 }Build it: 5. Watch the queue
- Report: click Chart
- Wire Queue's measure L (its length) onto the Chart's P[0]
- Start clean, hover the Chart to read values


Model codeOpen in Quisim
NumberInput { id: number0; initValue:125; label:"1/λ" }
NumberInput { id: number1; initValue:100; label:"1/µ" }
Wire { from: number0.measureValue; to: rnd0.parameterMean }
Wire { from: number1.measureValue; to: rnd1.parameterMean }
RandomExponential { id:rnd0; seed:11 }
RandomExponential { id:rnd1; seed:22 }
Wire { from:rnd0.measureRandomVariate; to:arrive0.parameterDuration }
Wire { from:rnd1.measureRandomVariate; to:perform0.parameterDuration }
Arrive { id:arrive0 }
Pipe { from:arrive0.outlet; to:queue0.inlet }
Queue { id:queue0 }
Pipe { from:queue0.outlet; to:perform0.inlet }
Perform { id:perform0 }
Pipe { from:perform0.outlet; to:leave0.inlet }
Leave { id:leave0 }
Wire { from: queue0.measureLoad; to: chart0.parameters[0] }
Chart { id: chart0; height:66; width:384 }The queue length jumps up and down: long quiet spells, then sudden bursts.
Build it: 6. Measure the time in system
- Report: click Statistics
- Wire Leave's measure LS (sojourn time of the last entity) onto its P[0]
- Start clean: it shows the mean time in system of the run


Model codeOpen in Quisim
NumberInput { id: number0; initValue:125; label:"1/λ"; lower:1 }
NumberInput { id: number1; initValue:100; label:"1/µ"; lower:1 }
Wire { from: number0.measureValue; to: rnd0.parameterMean }
Wire { from: number1.measureValue; to: rnd1.parameterMean }
RandomExponential { id:rnd0; seed:11 }
RandomExponential { id:rnd1; seed:22 }
Wire { from:rnd0.measureRandomVariate; to:arrive0.parameterDuration }
Wire { from:rnd1.measureRandomVariate; to:perform0.parameterDuration }
Arrive { id:arrive0 }
Pipe { from:arrive0.outlet; to:queue0.inlet }
Queue { id:queue0 }
Pipe { from:queue0.outlet; to:perform0.inlet }
Perform { id:perform0 }
Pipe { from:perform0.outlet; to:leave0.inlet }
Leave { id:leave0 }
Wire { from: queue0.measureLoad; to: chart0.parameters[0] }
Statistics { id: statistics0; height:48; width:128; label:"Sojourn\ntime" }
Wire { from: leave0.measureSojourn; to: statistics0.parameters[0] }
Chart { id: chart0; height:66; width:384 }
Your model is now the M/M/1 example. Lost track? Load it from the Examples tab and carry on.
Predict: a slightly slower server
Question
Set 1/µ from 100 to 120: service is 20% slower, . How much longer is the time in system ?


Model codeOpen in Quisim
NumberInput { id: number0; initValue:125; label:"1/λ"; lower:1 }
NumberInput { id: number1; initValue:120; label:"1/µ"; lower:1 }
Wire { from: number0.measureValue; to: rnd0.parameterMean }
Wire { from: number1.measureValue; to: rnd1.parameterMean }
RandomExponential { id:rnd0; seed:11 }
RandomExponential { id:rnd1; seed:22 }
Wire { from:rnd0.measureRandomVariate; to:arrive0.parameterDuration }
Wire { from:rnd1.measureRandomVariate; to:perform0.parameterDuration }
Arrive { id:arrive0 }
Pipe { from:arrive0.outlet; to:queue0.inlet }
Queue { id:queue0 }
Pipe { from:queue0.outlet; to:perform0.inlet }
Perform { id:perform0 }
Pipe { from:perform0.outlet; to:leave0.inlet }
Leave { id:leave0 }
Wire { from: queue0.measureLoad; to: chart0.parameters[0] }
Statistics { id: statistics0; height:48; width:128; label:"Sojourn\ntime" }
Wire { from: leave0.measureSojourn; to: statistics0.parameters[0] }
Chart { id: chart0; height:66; width:384 }
Run it: the queue climbs about twice as high (at most 15 instead of 8 in the pictured run), and is about 1270 instead of about 520.
- Theory says , six times as long as at 100. A run of 10 000 starts with an empty queue and is far too short to get there: near the queue needs a long time to build up
The Statistics example


Model codeOpen in Quisim
NumberInput { id: number1; initValue:100; label:"1/µ\nservice time"; lower:1; height:58; width:96 }
NumberInput { id: number0; initValue:125; label:"1/λ\ninterarrival time"; lower:1; height:58; width:112 }
RandomExponential { id:rnd0 }
Wire { from: number0.measureValue; to: rnd0.parameterMean }
Wire { from: number1.measureValue; to: rnd1.parameterMean }
Wire { from:rnd0.measureRandomVariate; to:arrive0.parameterDuration }
Wire { from: number2.measureValue; to: perform0.parameterCapacity }
Wire { from:rnd0.measureRandomVariate; to:arrive0.parameterDuration }
Wire { from:rnd1.measureRandomVariate; to:perform0.parameterDuration }
NumberInput { id: numberinput1; initValue:10000; label:"Duration"; width:112; lower:1; upper:1000000 }
NumberInput { id: numberinput0; initValue:20; label:"Replications"; width:112; lower:1; upper:100 }
NumberInput { id: number2; initValue:1; label:"k servers"; lower:1 }
Wire { from: numberinput1.measureValue; to: steering0.parameterDuration }
Steering { id: steering0; duration:50000 }
Wire { from: numberinput0.measureValue; to: steering0.parameterReplications }
RandomExponential { id:rnd1 }
Arrive { id:arrive0 }
Pipe { from:arrive0.outlet; to:queue0.inlet }
Queue { id:queue0 }
Pipe { from:queue0.outlet; to:perform0.inlet }
Perform { id:perform0 }
Pipe { from:perform0.outlet; to:leave0.inlet }
Leave { id:leave0 }
Statistics { id: statistics0; timeAverage:true; numParameters:2; warmupWidth:5000; label:"Queue length\nService load"; height:192; width:152; x:646; y:245 }
Wire { from: queue0.measureLoad; to: statistics0.parameters[0] }
Wire { from: perform0.measureLoad; to: statistics0.parameters[1] }
Statistics { id: statistics2; warmupWidth:5000; label:"Sojourn time"; height:192; width:152; x:646; y:12 }
Statistics { id: statistics1; numParameters:2; warmupWidth:5000; label:"Waiting time\nService time"; height:192; width:152; x:470; y:245 }
Wire { from: queue0.measureWait; to: statistics1.parameters[0] }
Wire { from: rnd1.measureRandomVariate; to: statistics1.parameters[1] }
Wire { from: leave0.measureSojourn; to: statistics2.parameters[0] }
Your M/M/1, plus a Steering block run 20 times (Replications). One row per run, then mean ± 95% radius. Compare with , , , .
The M/M/k example


Model codeOpen in Quisim
NumberInput { id: number0; initValue:55; label:"1/λ"; lower:1 }
NumberInput { id: number1; initValue:500; label:"1/µ"; lower:1 }
Wire { from: number0.measureValue; to: rnd0.parameterMean }
Wire { from: number1.measureValue; to: rnd1.parameterMean }
RandomExponential { id:rnd0 }
RandomExponential { id:rnd1 }
Wire { from:rnd0.measureRandomVariate; to:arrive0.parameterDuration }
Wire { from:rnd1.measureRandomVariate; to:perform0.parameterDuration }
Arrive { id:arrive0 }
Pipe { from:arrive0.outlet; to:queue0.inlet }
Queue { id:queue0 }
Pipe { from:queue0.outlet; to:perform0.inlet }
NumberInput { id: number2; initValue:10; label:"Capacity"; lower:1 }
Wire { from: number2.measureValue; to: perform0.parameterCapacity }
Perform { id:perform0 }
Pipe { from:perform0.outlet; to:leave0.inlet }
Leave { id:leave0 }
Wire { from: queue0.measureLoad; to: chart0.parameters[0] }
Wire { from: perform0.measureLoad; to: chart0.parameters[1] }
Statistics { id: statistics0; height:48; width:128; label:"Sojourn\ntime" }
Wire { from: leave0.measureSojourn; to: statistics0.parameters[0] }
Chart { id: chart0; numParameters:2; height:66; width:384 }
Capacity : Perform serves up to 10 entities at once. . The Chart shows queue length and busy servers.
Predict: two servers fewer
Question
Open Examples > M/M/k and set Capacity from 10 to 8. What happens to the queue?


Model codeOpen in Quisim
NumberInput { id: number0; initValue:55; label:"1/λ"; lower:1 }
NumberInput { id: number1; initValue:500; label:"1/µ"; lower:1 }
Wire { from: number0.measureValue; to: rnd0.parameterMean }
Wire { from: number1.measureValue; to: rnd1.parameterMean }
RandomExponential { id:rnd0; seed:11 }
RandomExponential { id:rnd1; seed:22 }
Wire { from:rnd0.measureRandomVariate; to:arrive0.parameterDuration }
Wire { from:rnd1.measureRandomVariate; to:perform0.parameterDuration }
Arrive { id:arrive0 }
Pipe { from:arrive0.outlet; to:queue0.inlet }
Queue { id:queue0 }
Pipe { from:queue0.outlet; to:perform0.inlet }
NumberInput { id: number2; initValue:8; label:"Capacity"; lower:1 }
Wire { from: number2.measureValue; to: perform0.parameterCapacity }
Perform { id:perform0 }
Pipe { from:perform0.outlet; to:leave0.inlet }
Leave { id:leave0 }
Wire { from: queue0.measureLoad; to: chart0.parameters[0] }
Wire { from: perform0.measureLoad; to: chart0.parameters[1] }
Statistics { id: statistics0; height:48; width:128; label:"Sojourn\ntime" }
Wire { from: leave0.measureSojourn; to: statistics0.parameters[0] }
Chart { id: chart0; numParameters:2; height:66; width:384 }
Run it: the 8 servers are busy almost all the time and the queue only grows, to about 30 at the end of the pictured run ( about 1340). With the same random numbers and 10 servers the queue ends empty and is about 575. : it needs servers.
Steering: duration, replications, seed


Model codeOpen in Quisim
Steering { id: steering0; duration: 100000; replications: 10; seed: 1 }
RandomExponential { id: rnd0; mean: 125; seed: 88 }
RandomExponential { id: rnd1; mean: 100; seed: 143 }
Wire { from: rnd0.measureRandomVariate; to: arrive0.parameterDuration }
Wire { from: rnd1.measureRandomVariate; to: perform0.parameterDuration }
Arrive { id: arrive0 }
Pipe { from: arrive0.outlet; to: queue0.inlet }
Queue { id: queue0 }
Pipe { from: queue0.outlet; to: perform0.inlet }
Perform { id: perform0 }
Pipe { from: perform0.outlet; to: leave0.inlet }
Leave { id: leave0 }
Wire { from: queue0.measureLoad; to: stats0.parameters[0] }
Wire { from: perform0.measureLoad; to: stats0.parameters[1] }
Statistics { id: stats0; numParameters: 2; timeAverage: true; label: "Nq / ρ"; x: 520; y: 0 }
Wire { from: leave0.measureSojourn; to: statsW.parameters[0] }
Statistics { id: statsW; label: "W"; x: 760; y: 0 }- Every block and property is editable; Steering sets duration D, replications R, editions E, seed S, speed V
- A fixed seed makes every run reproducible; seed 0 on a random block draws from the Steering seed. Levels need
timeAverage: true
More: Running a simulation
Experiments: compare configurations


Model codeOpen in Quisim
// Edition 0: one fast server (mean 100). Edition 1: two slow servers (mean 200 each)
Steering { id: steering0; duration: 200000; replications: 10; editions: 2; seed: 1 }
Function { id: fnConfig; numMeasures: 2; label: "configuration"
           code: "M[0] = [1, 2][P[0]]       // servers
M[1] = [100, 200][P[0]]   // mean service time" }
Wire { from: steering0.measureEdition; to: fnConfig.parameters[0] }
Wire { from: fnConfig.measures[0]; to: perform0.parameterCapacity }
Wire { from: fnConfig.measures[1]; to: rndB.parameterMean }
RandomExponential { id: rndA; mean: 125; seed: 11 }
Wire { from: rndA.measureRandomVariate; to: arrive0.parameterDuration }
Arrive { id: arrive0 }
Pipe { from: arrive0.outlet; to: queue0.inlet }
Queue { id: queue0 }
Pipe { from: queue0.outlet; to: perform0.inlet }
RandomExponential { id: rndB; seed: 22 }
Wire { from: rndB.measureRandomVariate; to: perform0.parameterDuration }
Perform { id: perform0 }
Pipe { from: perform0.outlet; to: leave0.inlet }
Leave { id: leave0 }
Statistics { id: stats0; numParameters: 2; label: "waiting time / time in system" }
Wire { from: queue0.measureWait; to: stats0.parameters[0] }
Wire { from: leave0.measureSojourn; to: stats0.parameters[1] }- Editions: the edition number EN drives a Function that sets each configuration; all editions share the seeds (common random numbers)
- Two slow servers: shorter wait (317 vs. 364), longer time in system (517 vs. 464). BrentOptimize and Explorer search parameters
More: compare configurations, find the best parameter, Experiment and Optimization Blocks
Warm-up: cut the start-up phase


Model codeOpen in Quisim
// M/M/1 (utilization 0.8) that starts with a backlog of 30 jobs: how long is the warm-up?
Steering { id: steering0; duration: 100000; replications: 10; seed: 1 }
Provide { id: provideBacklog }
Pipe { from: provideBacklog.outlet; to: meterBacklog.inlet }
Meter { id: meterBacklog; capacity: 30 }     // 30 jobs already waiting at time 0
Pipe { from: meterBacklog.outlet; to: queue0.inlet }
RandomExponential { id: rndA; mean: 125; seed: 11 }
Wire { from: rndA.measureRandomVariate; to: arrive0.parameterDuration }
Arrive { id: arrive0 }
Pipe { from: arrive0.outlet; to: queue0.inlet }
Queue { id: queue0 }
Pipe { from: queue0.outlet; to: perform0.inlet }
RandomExponential { id: rndB; mean: 100; seed: 22 }
Wire { from: rndB.measureRandomVariate; to: perform0.parameterDuration }
Perform { id: perform0 }
Pipe { from: perform0.outlet; to: leave0.inlet }
Leave { id: leave0 }
EnsemblePlot { id: welch0; timeAverage: true; batchWidth: 1000; label: "Welch plot of queue length" }
Wire { from: queue0.measureLoad; to: welch0.parameters[0] }
Statistics { id: statsAll; timeAverage: true; label: "queue length, no warm-up removed" }
Wire { from: queue0.measureLoad; to: statsAll.parameters[0] }
Statistics { id: statsMser; timeAverage: true; warmupMSER: true; label: "queue length, MSER-5 warm-up" }
Wire { from: queue0.measureLoad; to: statsMser.parameters[0] }- Non-terminating systems: the EnsemblePlot (Welch plot) shows where the start-up ends;
warmupMSER: truecuts it. Queue length 2.8 ± 0.6 (theory 3.2) instead of 6.1 ± 1.4 - Terminating systems (a shift, a day) have a natural end: keep the whole run
More: Output Analysis, warm-up recipe