
Case Study: Capacity Planning for a Hospital Emergency Department
Learning Objectives
- Formulate a practical problem as a simulation model
- Understand how time-of-day patient arrivals influence staffing decisions
- Determine optimal staffing levels through systematic parameter variation
- Use the Explorer block to automate a grid search across multiple scenarios
Problem Description
A hospital emergency department is open 24 hours a day.
- Patient arrivals vary strongly by time of day
- Each doctor attends to one patient at a time
- Too little staff → long waiting times, dissatisfied patients
- Too much staff → unnecessary costs
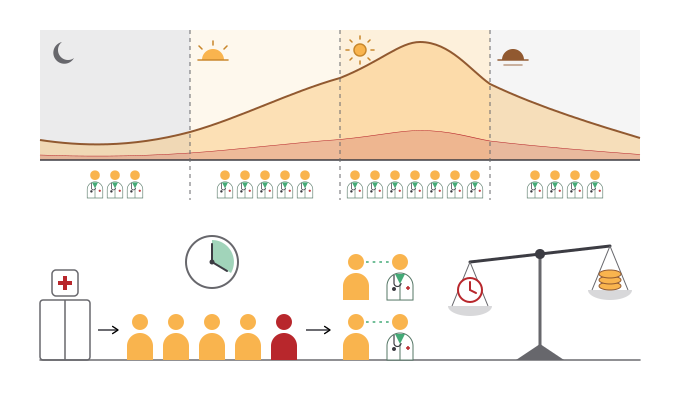
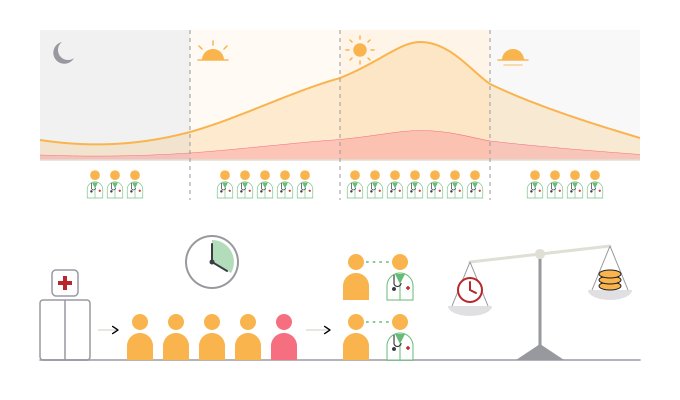
Objective: For each shift, determine the minimum number of doctors such that at least 90% of patients wait no more than 20 minutes.
Data
From historical data, the average inter-arrival time per shift is known:
| Shift | Time | Patients/h | (min) |
|---|---|---|---|
| Night | 00–06 | 2 | 30 |
| Morning | 06–12 | 6 | 10 |
| Afternoon | 12–18 | 10 | 6 |
| Evening | 18–24 | 4 | 15 |
- Mean treatment duration: minutes, independent of time of day
- Exponential distribution is assumed for both inter-arrival and service times
Minimum stability capacity : Night 2, Morning 4, Afternoon 6, Evening 3. However, stability alone does not guarantee an adequate service level.
Step 1: Single-Shift Base Model (Afternoon)
Starting with the peak-load shift (Afternoon, , ) at minimum capacity :
- Utilization:
- The queue exhibits strong fluctuations — typical at high utilization


Step 2: Measuring Service Level
A Function block checks per patient whether waiting time ≤ 20 minutes (1 = yes, 0 = no). A Statistics block averages across all patients to obtain the service level.
- 50 replications of 10,000 time units each (plus 500 time units warm-up)
- Result at : service level ≈ 69% ± 2% — well below 90%


Step 3: Sweep Over Capacity (Afternoon Shift)
Incrementally increasing capacity yields:
| Capacity | Utilization | Service level ( min) |
|---|---|---|
| 6 | 83% | ≈ 65% |
| 7 | 71% | ≈ 83% |
| 8 | 63% | ≈ 92% |
| 9 | 56% | ≈ 97% |
→ At the target service level of ≥ 90% is first met. Two additional doctors beyond the stability minimum are required.
Step 4: Automated Grid Search with Explorer Block
The Explorer block automates parameter variation across all 4 shifts × 10 capacity levels = 40 scenarios:
for (const mu_A of [30, 10, 6, 15]) {
  for (const c of [1, 2, 3, 4, 5, 6, 7, 8, 9, 10]) {
    M[0] = mu_A;  // set inter-arrival time
    M[1] = c;     // set capacity
    yield;        // start simulation run (one edition)
  }
}
Wiring:
- Explorer M[0] →
RandomExponentialmean () - Explorer M[1] →
Performcapacity () - Explorer M[0], M[1] →
StatisticsP[0], P[1] (for logging which shift/capacity) - Queue wait → Function (0/1 indicator) →
StatisticsP[2]
Statistics block settings:
- 40 editions (4 shifts × 10 capacities)
- 10
numBatchesper edition → confidence interval per edition via batch means - 500 time units
warmupWidthto exclude the transient phase - Total duration 10,500 time units → each batch covers 1,000 time units


Results
Critical Capacity c* (service level ≥ 90%)
| Shift | (min) | |
|---|---|---|
| Night () | 30 | 3 |
| Evening () | 15 | 4 |
| Morning () | 10 | 5 |
| Afternoon () | 6 | 7 |
Observations:
- The shorter (more patients per hour), the more capacity is required
- Confidence intervals are widest at the critical capacities — estimation is most uncertain exactly where the service level crosses the 90% threshold
- At ≈ 0% or ≈ 100% service level: negligible uncertainty (result is unambiguous)
Staffing Plan
The simulation yields the following minimum staffing plan:
| Shift | Time | Doctors |
|---|---|---|
| Night | 00–06 | 3 |
| Morning | 06–12 | 5 |
| Afternoon | 12–18 | 7 |
| Evening | 18–24 | 4 |
Total requirement: 3 + 5 + 7 + 4 = 19 doctor-shifts per 24 hours
This plan forms the basis for scheduling. In practice, additional factors apply: breaks, handover times, absences, part-time arrangements, etc.
Extended Model: Emergency Priority with Gamma-Distributed Treatment Times
This model extends the base model with:
- Gamma-distributed treatment times (shape , scale , giving mean min) — more realistic than exponential for medical treatment
- A separate emergency arrival stream ( min inter-arrival), prioritized via a Select block
- Priority logic: the Select block routes an emergency patient whenever the emergency queue is non-empty (checked via a Function block on
queue1.measureLoad); otherwise a regular patient is served


Priority Logic
The Select block routes from input 1 (emergency queue) when its selection parameter , and from input 0 (regular queue) when . The Function block:
M[0] = P[0] > 0 ? 1 : 0reads the current load of the emergency queue (queue1.measureLoad) and outputs 1 whenever at least one emergency patient is waiting, thus overriding regular patients.
Key Differences from the Base Model
| Aspect | Base model | Extended model |
|---|---|---|
| Treatment time distribution | Exponential () | Gamma (, , mean=50) |
| Arrival streams | 1 (regular only) | 2 (regular + emergency) |
| Routing | Direct queue → perform | Select block with priority |
| Regular inter-arrival | configurable | min |
| Emergency inter-arrival | — | min |
| Capacity | configurable |
Exercises
Exercise 1: Morning Shift
Parametrize the model for the Morning shift (, ):
- Start at minimum capacity .
- Increase stepwise until service level ≥ 90%.
- Document results in a table analogous to the Afternoon analysis.
Exercise 2: Sensitivity Analysis
Using the Afternoon model (, ), investigate the effect of:
- A stricter quality target: 95% instead of 90% service level
- A shorter waiting time threshold: 10 minutes instead of 20 minutes
- Mean treatment duration increasing to minutes
How many additional doctors are needed in each case?
Exercise 3: Two-Stage Process (Triage + Treatment)
Extend the model with an upstream triage stage:
- Triage (initial assessment): min,
- Treatment: min, = to be determined
Tasks:
- Build two Queue–Perform pairs in series.
- Determine for the Afternoon shift () so that service level ≥ 90%.
- Measure waiting time before triage and before treatment separately.
- Compare with the result without triage — where is the bottleneck?
Exercise 4: Emergency Prioritization
Extend the Afternoon model with an emergency entrance using a Select block:
- Regular patients: min
- Emergency patients: min (less frequent)
- Emergencies are prioritized (Select block with priority logic)
Tasks:
- Build the model with two Arrive–Queue paths merged via a Select block.
- Measure service level separately for regular and emergency patients.
- How does staffing need change compared to the model without emergencies?
- What happens to regular patient service level as the emergency arrival rate increases?